In the popular white paper entitled Troubleshooting SQL Server Wait Statistics, I take you through three scenarios in which a wait stats-only approach is insufficient or even harmful to detecting, diagnosing, and resolving performance problems on an instance of SQL Server. The white paper identifies FIVE key steps to effective performance troubleshooting on Microsoft SQL Server (below), with one follow-up step to basically learn from past problems.
SQL Server Troubleshooting Checklist

One of the most common questions that I get about the information in that white paper is “How do I do all of that cool stuff you do in Performance Advisor (PA) with the native tools?” The short answer is, you can’t always do everything we do in PA with the native tools. On the other hand, it is possible to do some, if not all, of the troubleshooting using native tools. And while the native tools are certainly a heck of a lot harder than using PA and have a lot of limitations, such as historical tracking of performance, you can get close to reproducing some elements of each of the troubleshooting steps I discuss in the white paper.
Steps 1 and 2: Determine whether the issue is inside or outside of SQL Server, and whether it is caused by an error
SQL Server always has wait statistics for something, even when it is at rest. On the other hand, if the performance problem originates outside of SQL Server, wait stat will never even give a hint of a problem.
As discussed in the white paper, Performance Advisor makes it very easy to see if a problem comes from inside or outside of SQL Server. In fact, it’s basically a one-step process.
Unfortunately, to get anywhere close to what PA does, you have to jump through several hoops. In the world of experienced DBAs, the first step is to check the Windows Event Viewer ==> Application Log and ==> System Log to make sure that there are no significant error messages related to other, non-SQL Server components of the corporate infrastructure.
Sidebar: I learned to make this the first step in my troubleshooting methodology, after wasting time trying to fix what I thought was a SQL Server problem. Only later, and after many wasted hours, did I discover that there was a host of DNS errors, or Domain Controller errors, or IO subsystem error messages.
An example of the Windows Event Viewer is shown below in Figure 1:
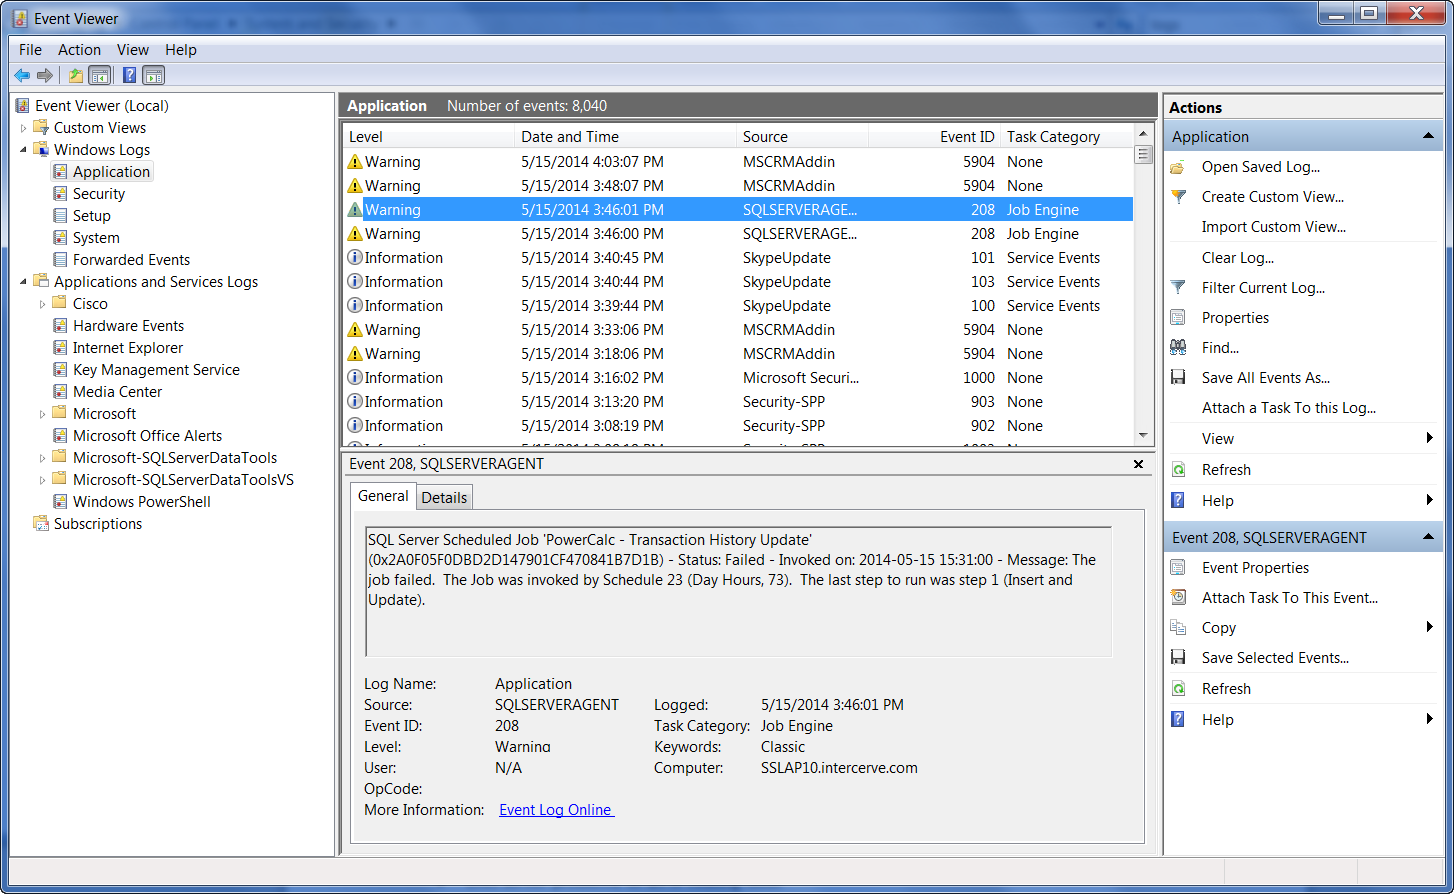 Figure 1: The Windows Event Viewer, Application Log
This brief step only takes a few moments to rule in or rule out behaviors coming from outside of the SQL Server itself, such as the network or the SAN. If a problem exists outside of SQL Server, you can quickly hand the problem off to the appropriate team. If there is no correlation to a problem outside of SQL Server, then you know to keep digging to the next level of investigation within the SQL Server stack.
If there is a non-SQL Server error in the Windows Error Logs, such as networking or storage array errors, you are now able to quickly hand off the problem to the appropriate team, if you work in a silo’d organization. And if not, you know now enough to work on the non-SQL Server error.
For an outstanding deep dive into the SQL Server error log, read Erin Stellato’s (b | t) post Proactive SQL Server Health Checks, Part 4 : ERRORLOG.
You may have noticed in the example shown earlier in Figure 1 that there was an actual SQL Server database error visible in the log. This points out the other benefit of checking the Windows error logs, namely, finding an error is often a good thing (yes, you heard it correctly) because the error message frequently points out where and how to remedy the problem. The alternative of finding no error is more research, sometimes a lot more, to properly diagnose and resolve the problem.
However, consider the warning message that appeared in Figure 1:
In this case, the problem is that an important job, invoked by SQL Server Agent, failed prior to completion. A waits-only approach to troubleshooting is likely to miss any sort of error like this because the problem at hand, the failed job, did not contribute to runaway resource consumption. In fact, because the job failed and terminated processing, this resulted in fewer resources consumed. A waits-only based approach would perceive this to be a good thing™.
Waits-only performance monitoring can fail to detect erroneous behaviors, especially when the error causes an abnormal termination of a process that reduces wait times.
Because we checked the Windows Application Log and saw that there was a SQL Agent job failure, we now have an easy course of action. Fixing this problem is as simple as troubleshooting the job so that it can complete successfully.
In a similar way, detecting an error in the course of performance troubleshooting provides three typical courses of action:
- The error has a well-documented remedy. Whether that remediation is easy (e.g. adding an index) or difficult (e.g. restoring from the last good backup) depends on the exact error.
- The error is not well-documented and requires further research, more data collection, and/or a call to Microsoft Support.
- There is no error message at all. More research is required. (Go to Step 2 in this document.)
To further illustrate the earlier point that you may be better off finding an entry in the Windows logs and/or SQL Server logs, consider that certain error messages, when encountered, have very easy fixes, such as SQL Server error 1101. This error tells you that SQL Server cannot allocate a new page for a growing database because of insufficient disk space in the file group. Although unfortunate, error 1101 is easy to fix, because only one of two things might have happened. One, the database file might not have been configured to auto grow. Or two, it was configured to auto grow and there is no more room on the disk where the database file is located. For the former problem, you simply change the configuration setting. For the latter, you could free up some space on the current disk so the existing file can auto-grow again, or you could add another database file on a different disk and let it grow there.
What Do You Mean that Errors Can Be A GOOD THING™?!?
Did that heading take you by surprise?
Yes, it’s true. When you’re experiencing performance issues, there are situations in which a SQL Server error can actually be a good thing. How so?
Consider this scenario that once caused me to lose a lot of hair. I was young and impulsive, and I hadn’t yet developed my troubleshooting methodology. So, I jumped right into a big set of stored procedures which I knew had notoriously poor performance. After all, what else could be causing these unexpected slowdowns, right? I’d spent the better part of two days tuning and refactoring the code and, while the code was much faster on my sandbox, it wasn’t helping overall improvement in the production environment.
Finally, I went back to the error logs and, lo and behold, there were a number of errors that showed we’d had a major networking fault and now the network routing was taking a long and circuitous route between our clients and the server. After angrily growling into the phone to our network team, the network speed suddenly improved, and everyone was much happier. Even I was happier at the end of the day, since the code I’d put in place was a big improvement and gave us back a lot of headroom on the server.
So, yes. Errors can be good. They offer, at times, an immediate and complete resolution to a performance problem. And, even if they are not always easy to resolve, most errors have a resolution of some kind – even if it’s a gristly sort of resolution, like restoring from backup. And since an extensive performance tuning engagement can last for days or weeks, even a one-day resolution can be much faster than the sleuthing and then remediation it takes to refactor poorly written SQL.
Handling Poorly Documented or Undocumented Errors
For errors of the second type, which are poorly documented, it is important to remember the value of your time compared to the time spent without a resolution for the problem at hand. It is very common to see newer and less experienced DBAs spending a lot of time and energy trying to diagnose and resolve a mysterious problem when they could have asked for help. If your time is worth something to you, and the application downtime is worth a great deal to the users, it usually pays to ask for help as soon as you realize the problem might be beyond your skill to resolve.
It pays to ask for help as soon as your realize the problem is beyond your skills to resolve.
Here is an example: In versions of SQL Server up through SQL Server 2000, if you ever encountered an error message relating to “Resource Semaphores,” you could count on the text of the message being the extent of the documentation, since there was nothing at all in the books. (Yes, we used books for error messages back in those days.) When comparing this behavior to IBM UDB, Oracle, or Sybase, this was very frustrating for an enterprise DBA because those platforms documented every error message that they could possibly raise. But not SQL Server. So the logical question is, “Why not?” As it turns out, all of those other relational database systems were designed to run on many different operating systems. And as a result, they had to entirely encapsulate their whole error messaging systems within themselves. Microsoft SQL Server, for all intents and purposes, has always run on only one operating system – Windows. After a great deal of careful research, a SQL Server DBA in 2002 would find out that a resource semaphore error had actually bubbled up through the Windows Server, surfacing as a SQL Server error. And only a call to Microsoft Support could have revealed those details.
Do not struggle too long with a difficult problem before asking for help. Know the value of your time and the time of your end-users.
Today, however, the Internet has opened up a worldwide community of helpful people. Be sure to take advantage of this community of knowledgeable and generous people early in your difficult performance troubleshooting projects before you squander too much time. Among the most popular places to post troubleshooting questions are the forums at dba.stackexchange.com and the official Microsoft MSDN SQL Server discussion forum. For quick questions, the Twitter hashtag #sqlhelp is very useful. And for SQL statement tuning and query plan analysis, the SQL Sentry forum at Answers.SQLPerformance.com is monitored by several very capable query tuning experts.
Make Sure to Implement SQL Agent Error Notifications
Let’s work smarter and not harder.
DBAs rarely get praised for times when their databases perform well or are error free. The most we DBAs can hope for from our users is benign neglect. One of the ways you can help ensure that your customers are not calling you frequently to complain (and thus building up negative sentiment) is to know about problems before your users do and, wherever possible, fix them before the users are even aware of an issue. SQL Server makes this possible for you through the use of SQL Server Agent Error Alerts.
Make it a practice to enable SQL Server Agent Error Notifications on errors of severity level 18 and higher.
What is significant about severity level 18 when it comes to SQL Server? Severity level 18 is the last of the information error messages and has a lot of useful information for performance troubleshooting of your SQL Server. At severity levels above 18, then something broke, failed, or was abnormally terminated within SQL Server. (Some useful deadlocking error messages are severity level 17. But you can enable them individually since severity level 17 has a lot of noise errors as well.) When you experience severity levels 19 and 20, you are typically experiencing low-level errors, such as a hiccup within a stored procedure. But at the higher severity levels, say at level 24 or 25, you may be getting an error that is the equivalent of “your server is on fire,” indicating that a database has been marked as suspect, that the server memory has become corrupted, or something else of equal concern.
To enable SQL Server Agent Error Notifications, in the SSMS Navigation Pane, click on SQL Server Agent ==> Alerts ==> right-click and select New Alert. You will then see a dialog box similar to that shown below in Figure 2:
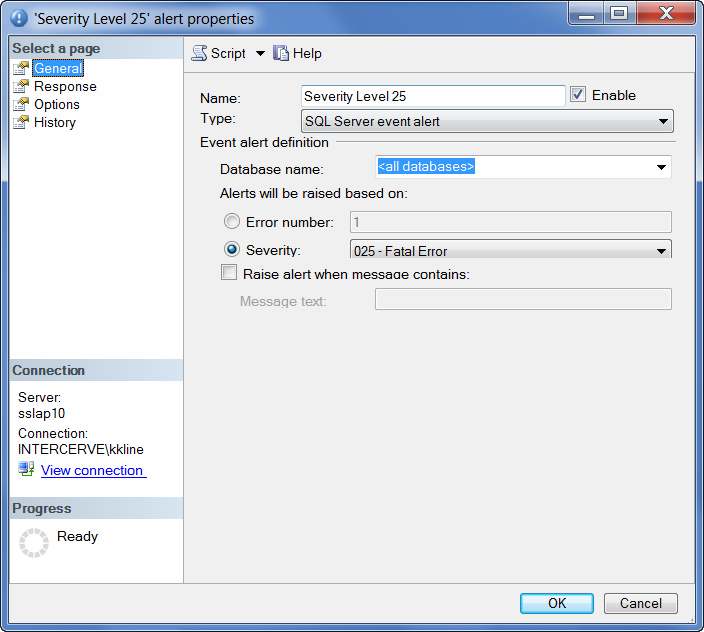 Figure 2: New SQL Server Agent Alert Properties Dialog Box
In this dialog box, you should provide your own name for the alert notification and choose the alert type of SQL Server event alert (from the Type dropdown list). Next, click the Severity radio button and choose the appropriate severity level from the dropdown list.
The basic alert is now configured. However, the most important part is how you respond to the alert, as found on the next page of the Alert Properties dialog. This is the Response section of the alert, as shown below in Figure 3:
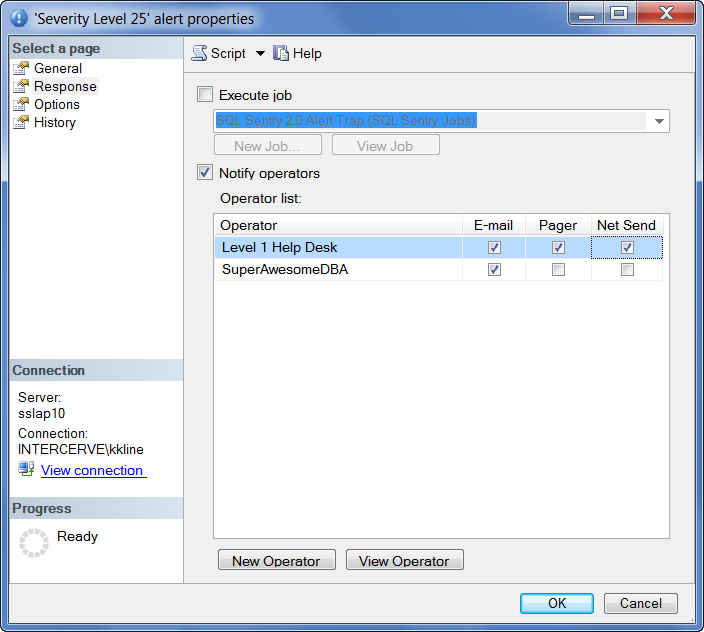 Figure 3: The Alert Properties Response Dialog Box
You can optionally choose a variety of ways to respond to an error of a given severity level, such as to invoke a specific SQL Agent job or to email, page, or Net Send a message to a given operator. At a minimum, make sure to create an operator who will receive emails and other forms of notifications when the significant error occurs.
You can see a better walk-thru of this process and pick up a script that will create all of the Severity Level SQL Agent alerts by reading Tim Radney’s outstanding article on SQLPerformance.com, Dealing with high severity errors in SQL Server.
Summary
Checking for errors isn’t hard, in and of itself. Setting up basic alerts for important SQL Server errors also is not too terribly hard, as a stand-alone activity. But the native tools offer very limited functionality and can be quite arduous, especially if you want anything more than the most basic alerts or a response to those alerts that is anything other than sending an email.
If you’ve gotten the idea that this is hard work with lots of limitations, caveats, and shortcomings – YOU ARE RIGHT. And that’s part of the reason why the SQL Sentry Performance Advisor product is so popular, because it makes all of this hard work I just describe into really easy work. If you’d like a demo of Performance Advisor, don’t hesitate to let me know. I’ll be delighted to get you a free trial license and give you a full demo.
Ok. That’s part two of the multi-part series complementing the white paper entitled Troubleshooting SQL Server Wait Statistics.
Have questions? Want more detail on a particular topic? Then get in touch with me!
-Kevin
Connect with me online! Facebook | Twitter | LinkedIn | Blog | SlideShare | YouTube | Google Author