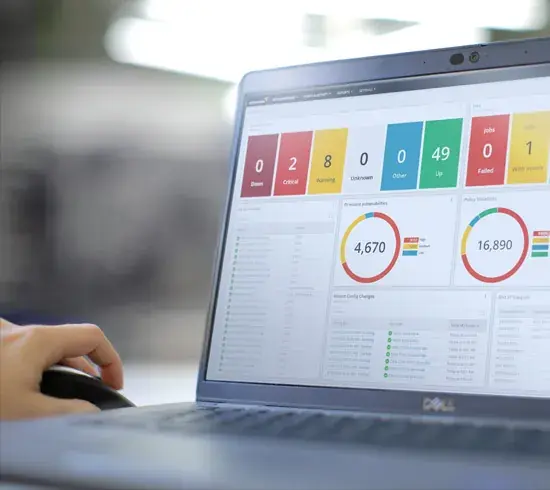
Observe everything from anywhere.
Trusted observability, database, and service management solutions - ready for every transformation.
Solve your biggest challenges, faster.
The SolarWinds Platform
IT Service Management
Database Performance
Network Management
Systems Management
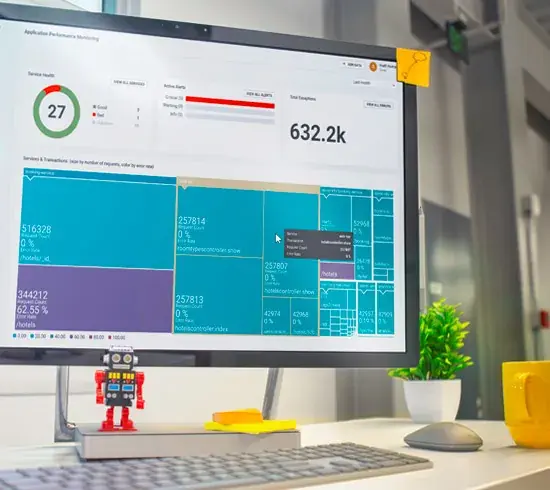
Application Management
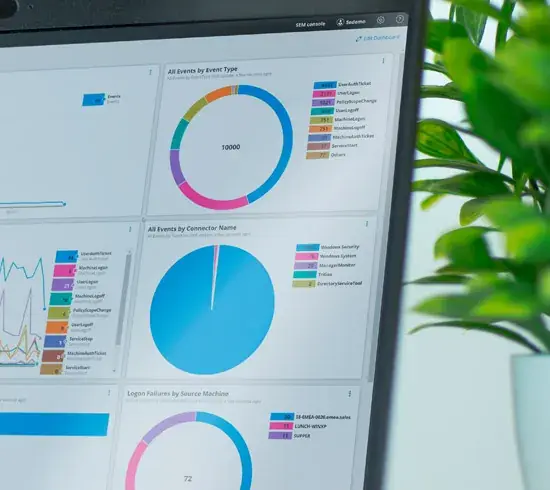
IT Security
Learn why SolarWinds is different.
SolarWinds Solutions, Innovations, and Leadership Earn International Industry Accolades
Award-winning, user-favorite products built to solve your most complex problems.
Taking SolarWinds Service Desk beyond IT
With the launch of Enterprise Service Management (ESM), it’s now easier than ever to extend everything you love about your SolarWinds Service Desk to other departments.
We’re setting the new standard in secure software development.
The threats we face today demand new defenses in software development. SolarWinds is leading the charge.
Saber Healthcare guarantees 99.9% SLA with SolarWinds Service Desk
Assisted living org reduces software spend by expanding SolarWinds Service Desk company-wide.

The highest compliment
is our customers’ trust.
“We felt the competitors were both more expensive and more difficult to configure and deploy. We selected SolarWinds… because it provided better value both in terms of cost and user experience.”
Experience yields Insights. Here’s some of what we’ve learned.

This report examines how the observability adoption process is going and how enterprises can maximize the advantages of their observability solutions.

This popular retailer achieved these savings by retiring an array of open-source tools and problematic SaaS-based IT monitoring tools.

SolarWinds Recognized in GigaOm Radar Reports as a Leader in Network and Cloud Observability