SQL Sentry Web Portal
Monitor your SQL Server environment from your web browser
Easily access the information you need to speed database performance
With SQL Sentry® Portal, you can view detailed, actionable information on the performance of your monitored SQL Server, Azure SQL Database, and Windows targets from your web browser.
SQL Sentry Portal connects to your SQL Sentry database and displays important performance information in an easy-to-use web interface.
- Reference the health score for your database environment
- View alerts and important performance metrics
- Create custom dashboards
- Analyze SQL Server queries and view query wait stats
- Easily share monitoring dashboards and alerts with others in your organization
Track your database environment health
Enhanced Environment Health Overview in SQL Sentry Portal provides easy insights to servers experiencing problems in your environment.
Using a 100-point health score, users can see the current health status, as well as the previous score history to understand which performance issues need to be addressed.
The alerts grid provides details on the alert and allows users to assign alerts, leave notes, and close events. You can view alerts by severity, tag to quickly identify conditions slowing database performance, and drill down into individual alerts for more details.
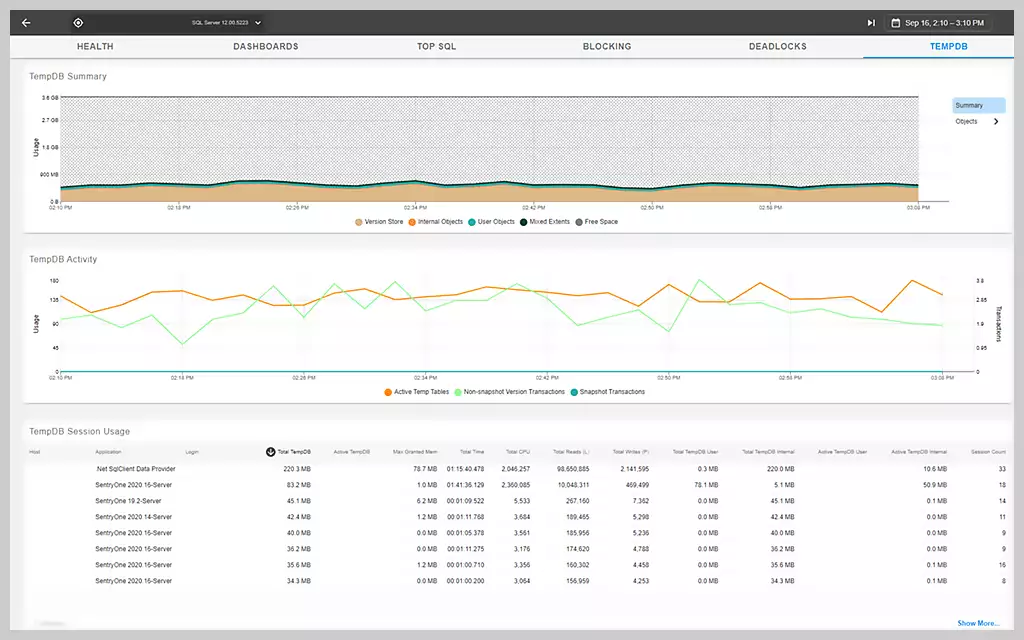
Monitor real-time and historical database performance
View important performance metrics for your monitored targets, including the following:
- SQL Server activity, waits, I/O, and memory
- Windows OS network utilization, CPU usage, I/O, and system memory
You can see real-time data or data for a specific time period using the default Dashboard view or by creating custom charts and dashboards to display the most important metrics.
Identify SQL Server query tuning opportunities
Quickly spot queries affecting SQL Server performance with the Top SQL view. Analyze high-impact SQL Server queries, view query plan diagrams, wait stats including trace event waits, and drill down into the query history for details about the execution plan, such as query duration, CPU consumption, and number of reads and writes performed.
Analyze SQL Server blocking
Quickly identify the root cause of SQL Server blocking in the Blocking view. With an intuitive graphical representation of a blocking chain, you can easily analyze blocking details and view the relationships between blocking and blocked sessions.
- View blocking by application, wait resource, or wait type
- Expand a blocking chain to view blocked sessions and understand the full impact of a block
- Switch between versions of a blocking chain to see if blocked SPIDs were added or removed
- View query text with syntax highlighting for any session within a blocking chain
Get More on SQL Sentry Web Portal
Do you find yourself asking…

Get started with SQL Sentry Portal
SolarWinds SQL Sentry
Fast root cause analysis
Visibility across the data estate
Deep, actionable performance metrics with easy deep-dive capabilities
Let’s talk it over.
Contact our team. Anytime.