In 2015, the U.S. Department of Homeland Security carried out covert tests on TSA Security at major airports to see how successful they would be at detecting potentially dangerous and/or forbidden objects before they made it on to commercial flights. If there is one form of monitoring that is both highly visible and puts a significant burden on the performance of the activity it monitors, it’s airport security.
As someone who does a fair amount of travel by air, I can confirm that the time it takes me to get through airport security is the number one factor in determining what time I need to leave for the airport to ensure I am able to catch my flight. Airport security certainly checks a lot of boxes we would consider for effective, comprehensive monitoring. It’s highly visible, with official looking uniformed personnel, high-tech equipment, lots of bells and whistles when things don’t seem right. Certainly, the price we pay for such a bottleneck to our fast and efficient transit from point A to B, must be highly effective in detecting potential issues in our travel environment, right?
Well, during that 2015 test, screeners failed to detect dangerous or illicit items 95% of the time. After serious evaluation and retooling, they tested again in 2017. Still, almost 80% failed to be detected.
The point of this introduction wasn’t to criticize the TSA, but to make a point about similarities between airport security and database performance monitoring tools. There are many tools and methods to gain visibility over our data estates. Many appear to be very comprehensive and authoritative. But ultimately, are they providing you security that everything is running as it should, or are they providing security theater?
Common questions you may want to ask yourself about your current tool are:
- Is it contributing to more issues than it is solving?
- Is it providing enough detail, and the right details, to truly help you quickly resolve, and ultimately prevent issues?
- When something’s not right, is it properly and promptly supported by live, experienced engineers?
- Can it scale with your data estate’s expected growth?
- Is it everywhere you need to be? (On-premises, virtual, multi-cloud, hybrid…)
The Cost of Downtime/Slowtime
Trying to apply an overall dollar figure to application downtime is an inexact science, but many organizations like Gartner have done a good job giving us some information to go on.
According to Gartner, the average cost of IT downtime is $5600 per minute. That’s a broad figure, and much of it based on the size and nature of the company. That said, even small companies can see costs approaching $100,000 per hour of downtime, with larger companies seeing those costs in excess of $1 million per hour. Conversations I’ve had with customers have supported those figures. Slowtime, while estimated at one fifth the cost per hour of downtime, tends to occur ten times as often.
Obviously, there are a lot of factors to consider, but the point is that downtime and slowtime costs to any company can add up very quickly. So, speed to identify, determine root cause, resolve, and ultimately avoid these incidents has tremendous value to any company.
Now that we’ve established the value of speed to root cause and mitigation, let’s review some of the common tools and methods commonly seen in customer environments meant to reduce those costs.
Application Performance Monitoring (APM)—Good Enough?
There are many tools out there that do a good job of providing high-level, application performance monitoring. They give you visibility to the general health of your environment. There have also been many studies around these tools which come to similar conclusions when it comes to effectiveness. The consensus is that the majority of respondents say the most common source of application performance issues is the data platform.
At the same time, a majority say APM tools point you in the right direction, but rarely identify the root cause of those data platform issues. Ultimately, additional manual gathering of data through other means is necessary to troubleshoot and resolve the issue.
All of this means incomplete solutions and much longer time to root cause analysis, as well as more difficult long-term optimization to mitigate such issues in the future. APM tools are good to give you that broad view across your network, but don’t often give you the depth of visibility into the data platform so often needed to get to the root of your performance issues.
Custom Scripts—Good Enough?
Any DBA who has been around long enough has likely accumulated some custom scripts they’ve either found online or have developed themselves. These scripts are often used to augment another tool as previously discussed, or by themselves as specific needs arise.
There are several limitations when relying on a library of scripts for long term use. It’s not likely you’ll ever get a complete picture of your environment this way. Often these scripts are fit for a specific purpose and once that fire has been extinguished, may rarely provide value again. Those that do provide longer term value often become difficult to maintain as your environment grows and evolves, and technology changes. Maintaining them can become a full-time job in itself, and rarely are you going to get the granularity and/or significant historical detail needed to easily find that root cause and prevent future occurrences.
Wait Stats Focus—Good Enough?
With on-premises SQL Server alone, there are potentially thousands of performance counters, DMVs, and trace and extended events available to collect and investigate SQL Server related activity. Many of these metrics may not be pertinent to performance or have any actionable value in most cases.
Because of this, there is a common temptation of an overly simplistic focus on wait stats. “If I know what waits are associated with my queries, I know exactly what’s wrong and I don’t need to worry about all the other information available to me.” It feels like a shortcut to success, but as with most things in life, that rarely turns out to be the case.
Wait stats at the server level are a great place to start to get a feel for the performance profile on your server and where issues may be experienced. But it’s just that, a great start. Like the other methods we mentioned, ultimately you find yourself in need of more information from other sources to get the complete picture and determine root cause.
What’s worse, focusing on wait stats, especially at the query level, can lead you to wrong conclusions altogether. There’s a great analogy I like to steal from my colleague, Richard Douglas. Imagine you’re in line at the grocery store checkout. You have your items and are ready to pay, but the person in front of you at the register pulls out a handful of coupons to be scanned. According to query level wait stats, you are doing all the waiting. You are ready to check out but can’t. The root cause, however, is the person in front of you with all the coupons being scanned. They are doing work, they are scanning items, so there is no wait for them. If you focused on query level wait stats, you would focus on the person waiting in line with no visibility into what, or in this case who, you’re waiting on or why. You’re essentially looking to treat the symptom, not the illness.
Finally, and possibly the biggest pitfall of this methodology is the fact that, by focusing on waits, you are constantly in a reactive stance. By definition, there must be things already waiting before they even show on your radar to address. Without any other comprehensive view, there’s no way to truly get to a more proactive, optimized state.
For a deeper technical dive into the limitations of this methodology see SentryOne Chief Scientist Greg Gonzalez’ article, “Why Wait Stats Alone Are Not Enough.”
Common Shortcomings of Database Performance Monitoring Tools
Up to this point I’ve focused primarily on tools and methods used instead of dedicated Database Performance Monitoring (DPM) products. Now I’ll share some common shortcomings of dedicated DPM tools that often appear to “check all the boxes,” but much like our TSA story at the beginning of this post, fall far short when it counts most.
Lack of Sufficient Detail
The lack of detail I typically see in DPM tools today comes in a few different forms. The most obvious are the counter-based metrics like CPU, IO, etc. Some products and home-built solutions only capture snapshots of this data every several minutes. Often this is due to the onerous means of collection where you don’t dare collect with any higher frequency without risk of over-burdening the monitored server just to collect the needed data. This is typically due to inefficient means of collection, as products like SQL Sentry can provide 10 second granularity of much of this data with much less overhead than other products that provide these multi-minute snapshots. This is an area where our wealth of industry experience and expertise makes such a big difference in getting you the most valuable information.
Other limitations I’ve seen involve query level details, where only the Top N queries are ever collected or shown, regardless the level of activity on the server. Others again focus on queries based on their own waits, as opposed to the actual resource consumption of the request where you are much more likely to identify the root cause.
Lack of Proper Support
Regardless of the tools or methods you choose, data estates can be very diverse and complex. Even in smaller, simpler environments, we’re still talking about active, dynamic, technology where one size does not fit all, and complications may arise. That’s why it’s vital, regardless the tool, that it’s backed by responsive, expert support engineers to ensure that the tool is running optimally, and you are getting the most value from it. Especially when that dreaded downtime hits, if you’re struggling to get the needed insight from the product, you want to know there’s an expert on the line that can help get you on track and ensure you get the visibility for which you paid. I’ve talked to many customers who have astounded me with their stories of entire spreadsheets of open support tickets they had with another vendor that went unanswered for months on end. What good is a monitoring tool, if you can never get the support you need to get it running properly in the first place?
A Customer Story
This brings me to a story about one of our larger customers at SentryOne. Several years ago, this customer was first evaluating DPM tools and was considering SentryOne SQL Sentry against a couple other competitors. SQL Sentry had easily secured the technical win as we often do. No other product provided the pertinent metrics with the needed detail and with less monitoring overhead. This particular customer actually purchased a few licenses of SQL Sentry along with others to perform a longer, “proof of concept” evaluation before making their decision.
At the last minute, a competing product made an offer of a significant price reduction to the decision-maker; tens of thousands of dollars less than originally proposed. Even though this product was deemed technically inferior, the decision maker saw an opportunity to go with a “Good Enough” product in order to seemingly save the company some money.
Fast forward a year or so later, and this company had a major outage. In line with our estimates early in this post, a company of this size was losing upwards of $1 million an hour for multiple hours, and the DPM tool where they saved tens of thousands of dollars at purchase time, wasn’t helping them determine what was wrong or how to resolve the issue. To make matters worse, the vendor’s support team was unhelpful.
Finally, with millions of dollars lost after several hours, one of their team remembered they still had a couple of SQL Sentry licenses from the original POC. They started it up, pointed it at their problem server, discovered the issue, and had things back up and running in minutes.
In direct terms, “Good Enough” cost that company millions of dollars. Shortly thereafter they performed a wholesale replacement of that tool with SQL Sentry.
Scalability—Good Enough?
Most DPM tools on the market have the same limitation when it comes to how many servers they can monitor with a single installation of their product. The primary bottleneck comes from the fact that they are all backed by a SQL Server database to store all the data they collect. Because of this, these products start to choke somewhere in the neighborhood of 200 to 300 monitored SQL Servers. For many years, the SentryOne monitoring platform had a similar limitation.
In order to monitor more than this, which is common in larger enterprises, you had to deploy multiple installations to cover the entire enterprise. A couple products handle this by supporting multiple back-end databases from a single interface. While that approach prevents you from having to launch multiple clients to view the entire estate, it requires significant cost and administrative overhead. You must provide resources and licensing for each server that hosts a product database, administer it and keep all these additional moving pieces running just to maintain your monitoring. That results in significant additional costs and labor beyond the original cost of the tool itself.
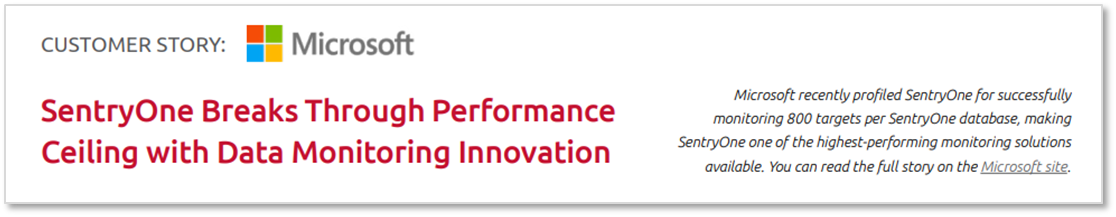
SentryOne has overcome this much more elegantly, supporting environments closer to 1000 servers or more with a single SQL Server database. This is due to the cutting-edge technology architected by our internal experts to further provide value to our customers, and further increasing our Return on Investment (ROI). In fact, Microsoft wrote a case study on SentryOne, touting our use of In-Memory OLTP technology, among other technologies, to break through this performance ceiling.
DBA Happiness – Good Enough?
One of the less tangible, but certainly relevant areas where the right tools can save you money is DBA happiness. I mention this primarily because it’s something that several customers have brought up as a reason for looking for a better monitoring solution. Others have expressed their gratitude after implementing the SentryOne monitoring platform as they have become better DBAs from what they’ve learned through using SQL Sentry.
It’s no secret that there is a skills gap in the IT industry as a whole, and in the data sector in particular. There is a significant cost to losing talent, not to mention training and retention of current talent. Working in the DBA and related fields can be thankless and tiring. There is a reason why we joke about DBA standing for Default Blame Acceptor. Most people I talk to who are looking for help are constantly reacting to issues and primarily in “firefighter mode.” Without proper visibility and detail, it’s almost impossible to get into a more proactive stance and get time to work on more strategic initiatives. Without the proper tools and methodology, it rarely gets better.
That’s why we say SentryOne improves the quality of life for Microsoft data professionals and their customers. But don’t take my word for it. One of my favorite review titles we have received on TrustRadius is “Use SentryOne and get to spend more time at the beach.”
The ROI of SentryOne
So, the bottom line is pretty simple. We’ve shown how much downtime and slowtime in the data layer can cost an organization. We’ve talked about how an effective DPM product needs to do more than “check the boxes.” It can mean the difference between costing your organization millions of dollars during that next outage and mitigating those costs or preventing those critical and high priority events from occurring in the first place.
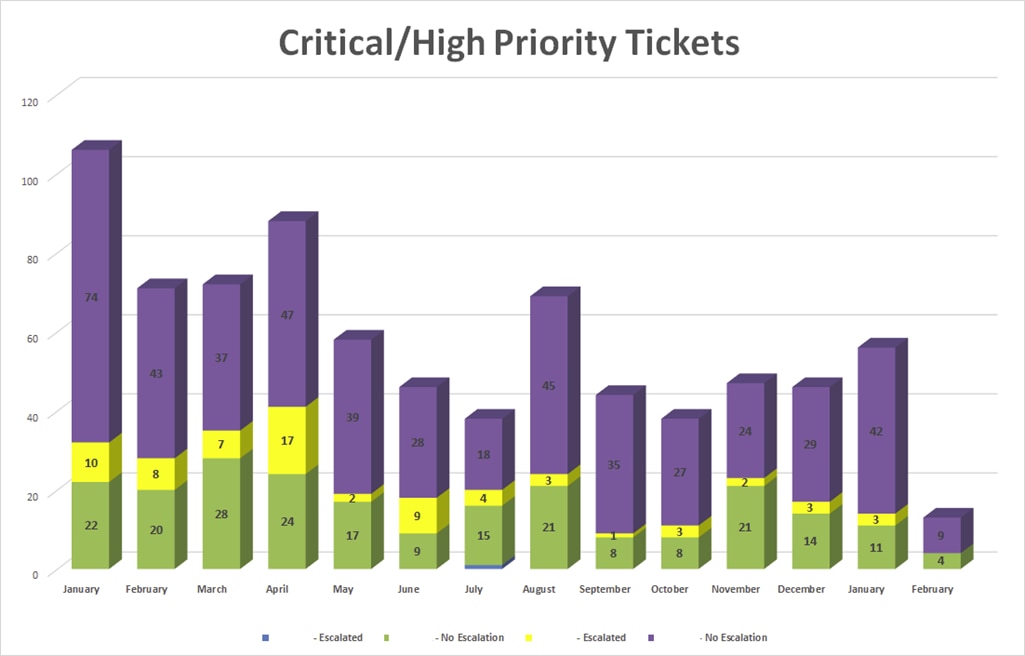
But don’t take my word for it. According to SentryOne customers, implementing the SentryOne monitoring platform and applying best practices to get you from reactive to proactive can reduce those P1 and P2 issues up to 40% or more year over year. Here’s data provided directly by a customer showing that impact after implementing SentryOne.
So if “good enough” has been costing your organization money, as it has so many people I’ve spoken to over the years, I encourage you to sign up for a free trial and evaluate SentryOne monitoring solutions for the Microsoft data platform on-prem, in the cloud, or across hybrid environments and take those first steps towards truly optimizing your data performance.
You can also generate your potential ROI with SentryOne SQL Sentry by using our new ROI calculator. Simply fill out the form and have the results emailed directly to you!